Custom graphs and trends (Analyitcs)
Материал из WebHMI Wiki
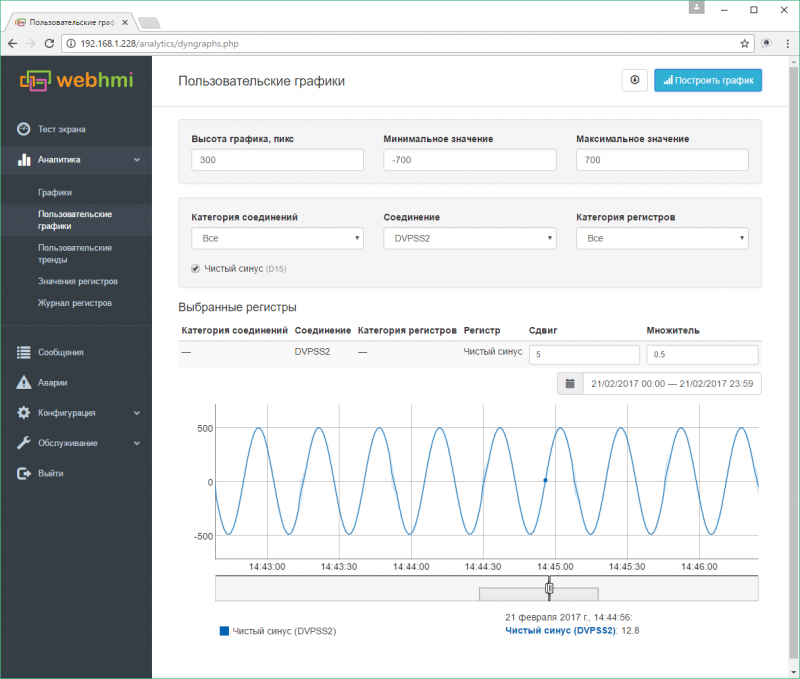
Custom trends and graphs do not need to be created and configured in the Setup menu section. Their main purpose is to quickly analyze the processes, quickly changing the set of parameters, shift and scale them for easy viewing. Registers that are selected for dynamic charts (ie historical ones) must have the 'Save data for graph' option set.
They are accessed in Setup --> Analyitcs menu:

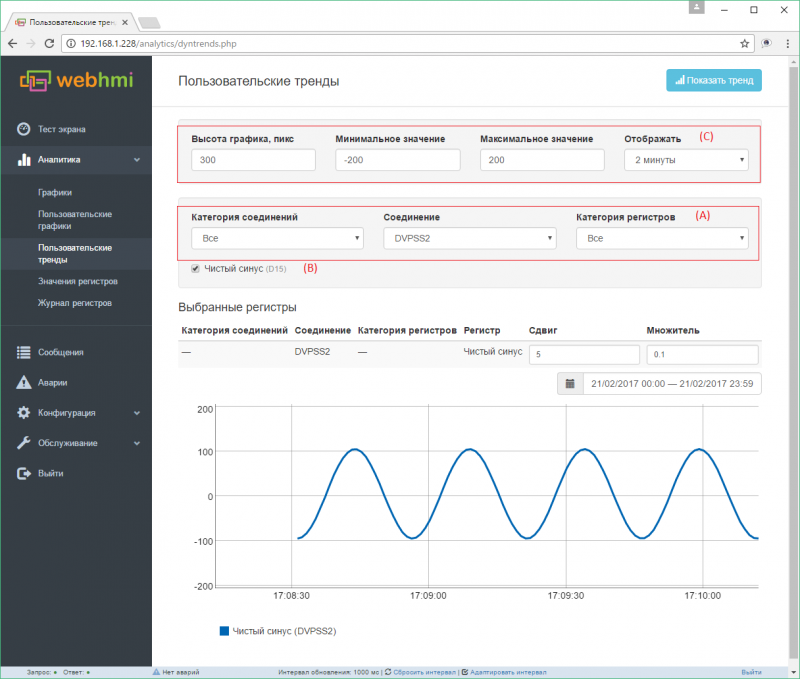
The windows for custom trend setup:

- Area А - The filtering area of the register set by categories
- Area В - area of selection of specific registers from the received set
- Area С - customize the graphics display
Shift field allows to distribute curves along the vertical axis Multipy field allows to scale curve using the multilpier
In this example "sinus" parameter shifted up for 5 units and scaled down by 10 (х0.1).