Построение графиков в Level2/en — различия между версиями
(Новая страница: «If WebHMI [//wiki.webhmi.com.ua/index.php/%D0%9F%D0%BE%D0%B4%D0%BA%D0%BB%D1%8E%D1%87%D0%B5%D0%BD%D0%B8%D0%B5_WebHMI_%D0%BA_Level2/en is connected to Level2], then…») |
(Новая страница: «Now in Level2 on the "Charts" page, you can plot a graph for this register (as well as any others for which this option is activated). To do this, select the node…») |
||
| Строка 6: | Строка 6: | ||
If WebHMI [//wiki.webhmi.com.ua/index.php/%D0%9F%D0%BE%D0%B4%D0%BA%D0%BB%D1%8E%D1%87%D0%B5%D0%BD%D0%B8%D0%B5_WebHMI_%D0%BA_Level2/en is connected to Level2], then in a few moments the system will send to Level2 the information that it is possible to build a graph on this register. All new graph data for this register will be sent to Level2. The old data that was accumulated before enabling this option will not be sent. <br> | If WebHMI [//wiki.webhmi.com.ua/index.php/%D0%9F%D0%BE%D0%B4%D0%BA%D0%BB%D1%8E%D1%87%D0%B5%D0%BD%D0%B8%D0%B5_WebHMI_%D0%BA_Level2/en is connected to Level2], then in a few moments the system will send to Level2 the information that it is possible to build a graph on this register. All new graph data for this register will be sent to Level2. The old data that was accumulated before enabling this option will not be sent. <br> | ||
| − | + | Now in Level2 on the "Charts" page, you can plot a graph for this register (as well as any others for which this option is activated). To do this, select the node, connections, and check the registers that you want to display on the graph. Click the "Build a Graph" button. <br> | |
[[Файл:Level2-graphs.png|600px]] | [[Файл:Level2-graphs.png|600px]] | ||
Версия 15:27, 21 ноября 2017
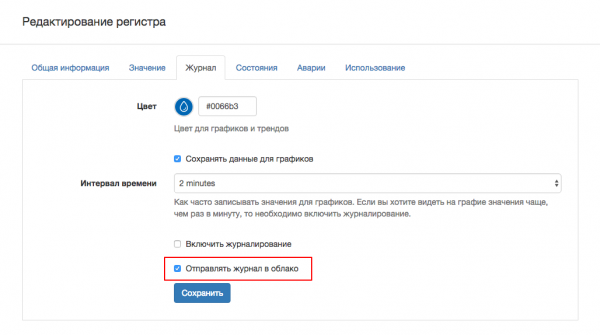
WebHMI can export the accumulated graph data to the Level2 system. To do this, select the option "Send log to the cloud" in the settings of the desired register.
If WebHMI is connected to Level2, then in a few moments the system will send to Level2 the information that it is possible to build a graph on this register. All new graph data for this register will be sent to Level2. The old data that was accumulated before enabling this option will not be sent.
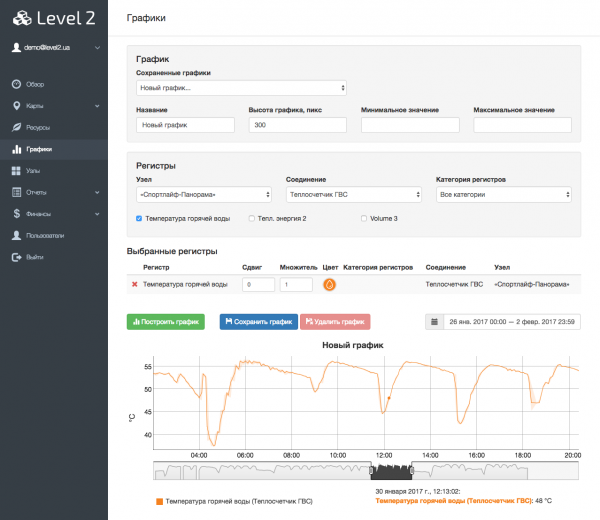
Now in Level2 on the "Charts" page, you can plot a graph for this register (as well as any others for which this option is activated). To do this, select the node, connections, and check the registers that you want to display on the graph. Click the "Build a Graph" button.
Также, для каждого выбранного регистра можно указать множитель и сдвиг значения и цвет линии. Множитель и сдвиг удобно использовать если на одном графике необходимо отобразить множество дискретных значений (0/1). С помощью сдвига их можно разнести по вертикальной оси так, что бы они не перекрывались.
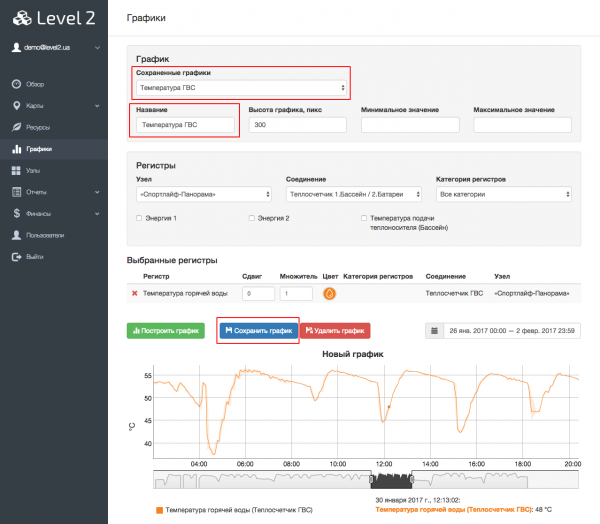
Для более удобного и быстрого построения одних и тех же графиков, можно сохранить текущие выбранные регистры и их параметры. Для этого введите желаемое название в поле "Название" и нажмите кнопку "Сохранить график". В дальнейшем этот график появится в списке "Сохраненные графики" в верху страницы и при его выборе он будет построен автоматически без необходимости выбирать интересующие регистры снова.


