Dashboards
Содержание
Creating dashboards
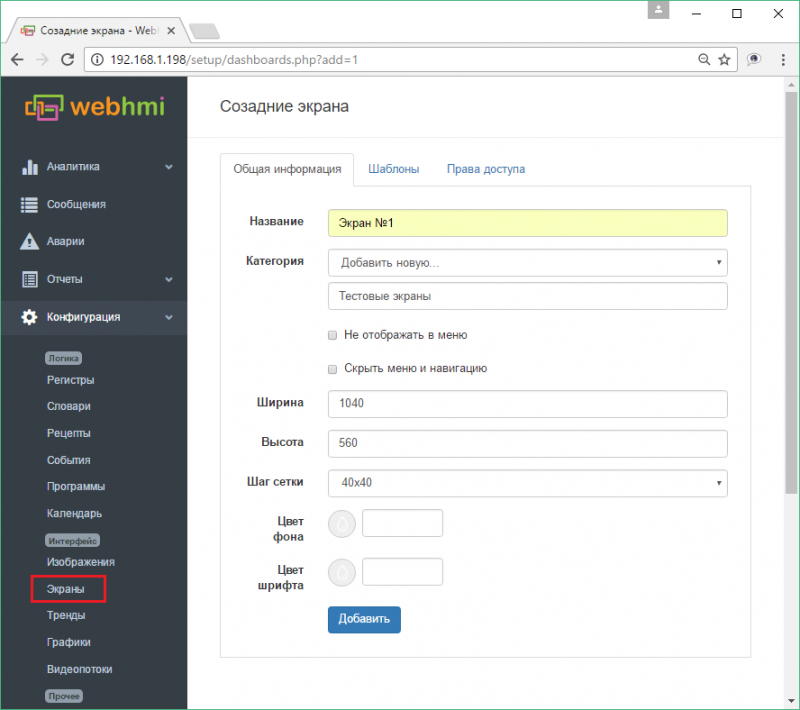
In WEBHMI, screens or dashboards (Dashboards) are analogous to screens for operator panels or graphic screens in SCADA systems. You can create multiple screens that will be available after you create the Dashboard menu. For example, create the 'Dashboard 1' screen, using the menu item 'Configuration / Screens Setup / Dashboards'.
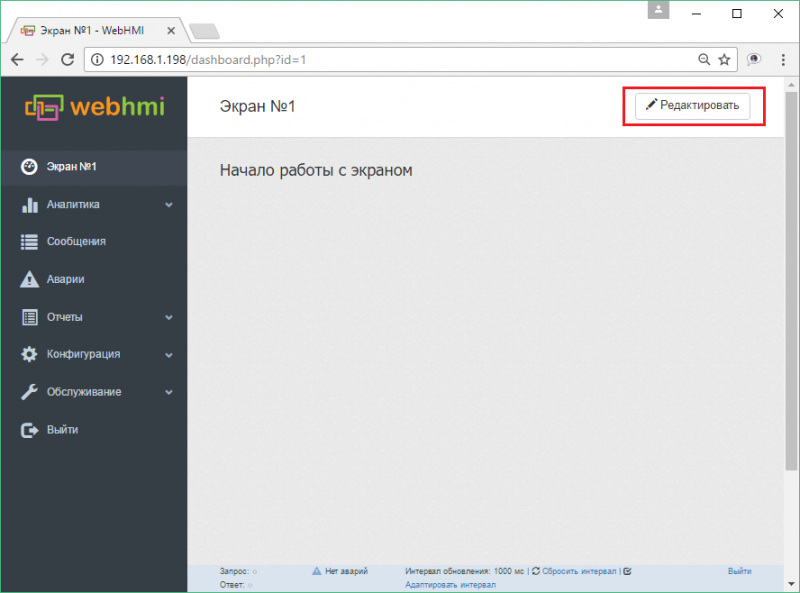
Go to the visual editor of the screen in two ways: by clicking the button in the list of dashboards, or by clicking the button, while on its page.

Appearance of the new dashboard panel in the editing mode:
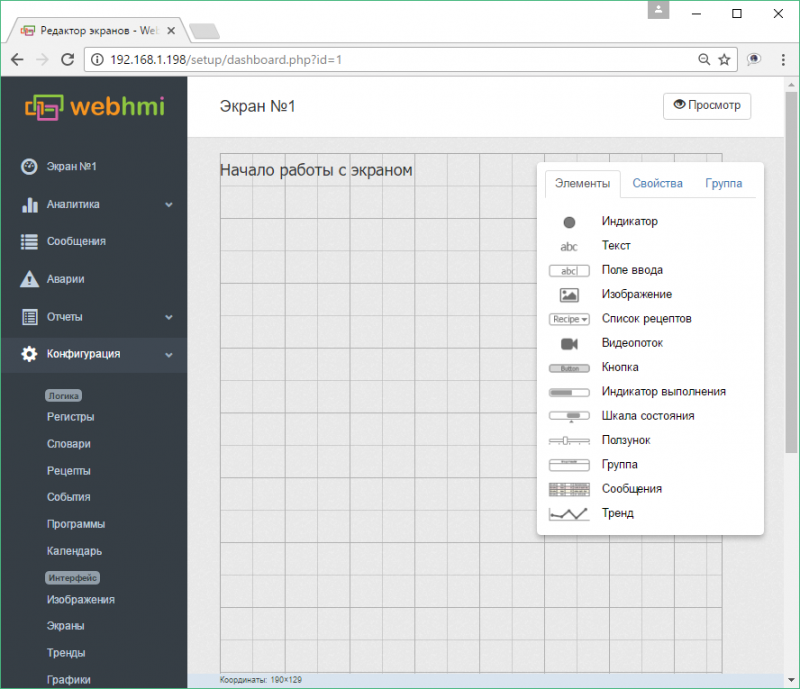
After that, you can proceed with the layout of the visualization elements on the dashboard. The necessary elements are placed on the field by 'dragging' them from the toolbar.
The toolbar has 3 tabs:
- Controls - list of controls
- Properties - properties of the currently edited item
- Group - group operations, is activated when more than two items are selected
After selecting a group, the following operations are available through the tab Group:
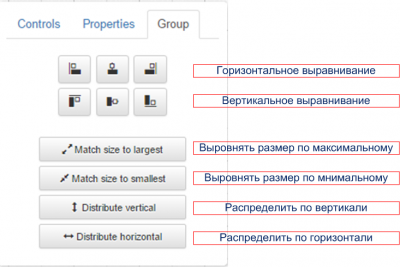
The following kinds of visualization elements are available:
- Indicator - LED
- Text
- Text edit box
- Images
- Video - streams
- Buttons
- Progress indicators
- Gauge
- Slider
- Group
- Message table
- Trends
The editing field has a grid with a step of 40 pixels (the grid step can be redefined in the properties of the screen), by which the elements will be aligned. If necessary, align the object more accurately, this can be done by holding Shift .
When editing, the following 'hot keys' are supported -
Ctrl+A (select all), Ctrl+C (copy), Ctrl+V (paste), Ctrl+X (cut), Ctrl+D (cancel selection). Also, you may select control elements with the clicking on desired elements with Ctrl pressed.
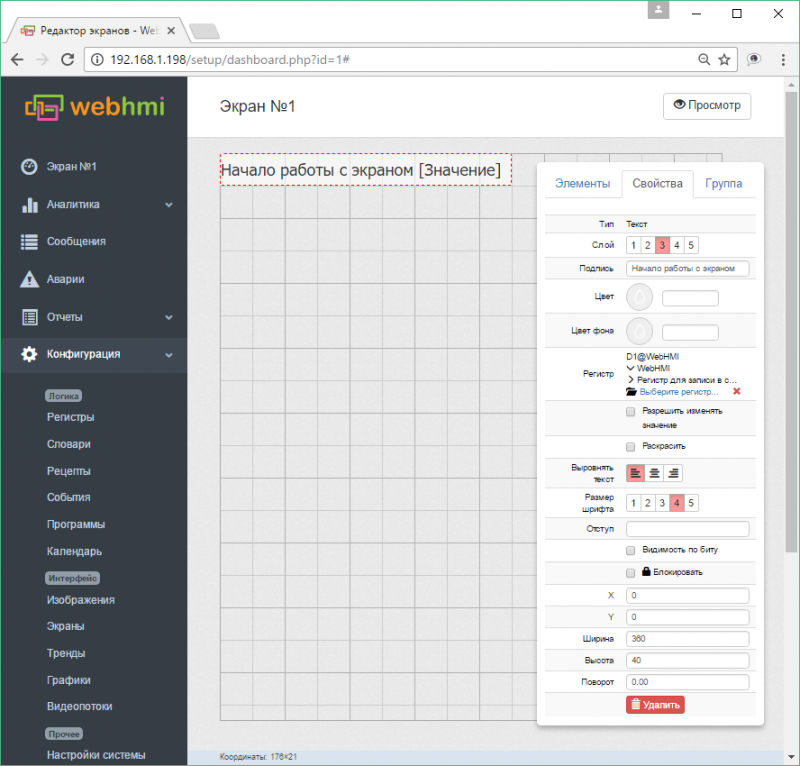
Text elements
Elements of the text allow placing them on the dashboard either as a static text (or register value), or the line that makes up them. If there are units of measurement in register properties, they will also be displayed after the value of the register. Setting the 'Allow change value' attribute turns the text into a field for entering a value into the register. A text element can also inherit color signaling of the state of the register. There are 5 variants of font size (in relative units) and 5 layers (the layer with the larger number is closer to the user looking at the screen). Text can also be a convenient reference to another dashboard, trend or graph. See Fig .:
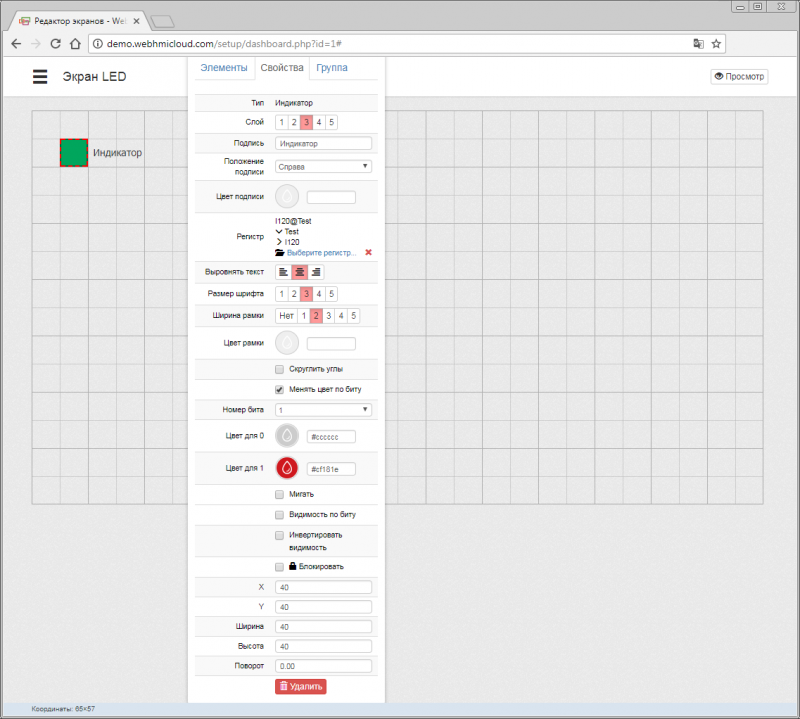
Indicators - LED
LED indicators are a convenient ready-made element for indicating the discrete state of the register. Below is a description of its settings.
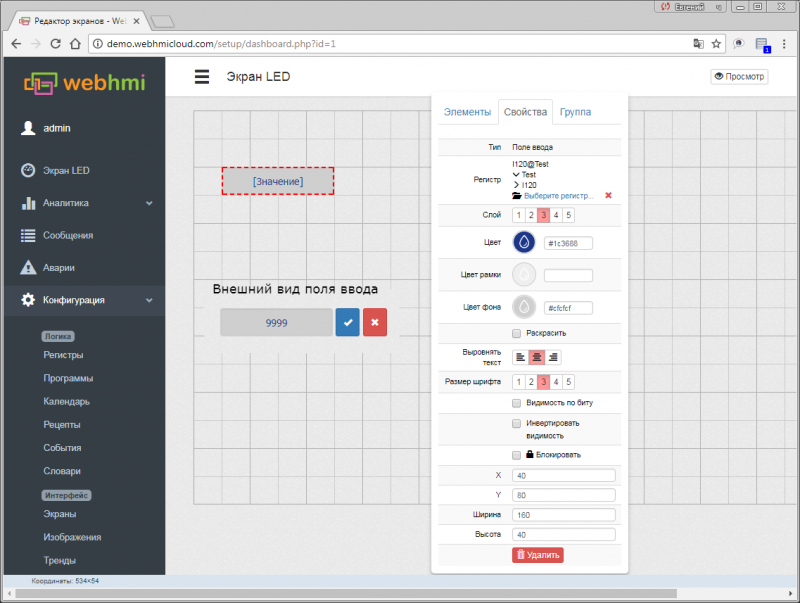
Edit box
Although the values of parameters displayed on the screen in the form of text can be changed using the attribute 'allow to change the value', sometimes it is more convenient for the user to differentiate the values of the parameters viewed only and those whose values can be changed.
The edit box allows you to specify a frame, a background for such parameters, and highlights the value and undo buttons.
Images
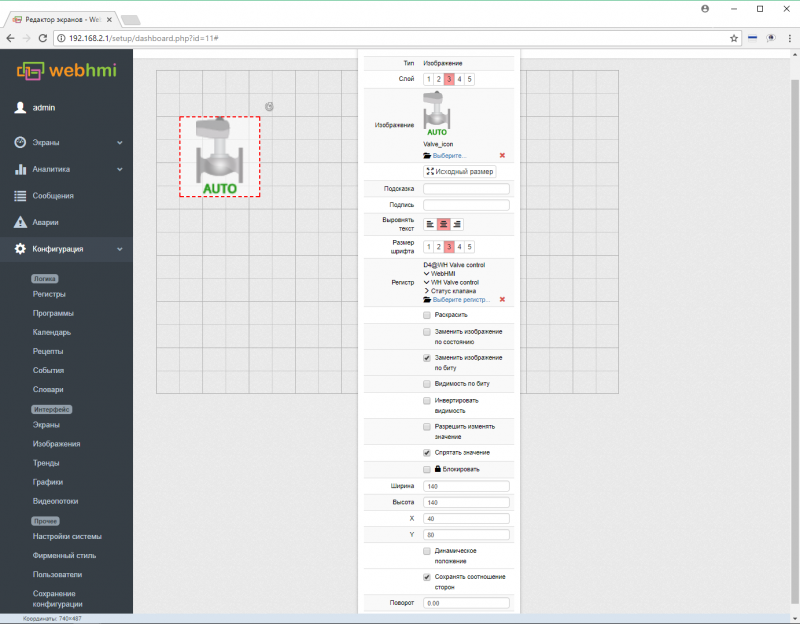
It is possible to put images from the image library onto the dashboard. Image may serve for several functoins -
- just an image as visual element
- object state indicator - ON/OFF, color state signalling
- as a control element, like button, which after being pressed can change register value
- dynamic element - moving along axis or change visibility
Для добавление изображения в библиотеку их надо предварительно загрузить через меню Setup/Image library.
Изображения в роли индикаторов
Одной из функций изображения может быть отображение цветовой сигнализации состояний регистра (states),
Для того, чтобы все состояния выглядели одинаково во всем проекте, желательно использовать цвета по умолчанию, которые предлагаются при описании состояний (хотя их можно и переопределить). Также желательно производить нормализацию изображений для индикаторов (см. описание опции в разделе "Изображения"). Пример использования индикатора приведен ниже.
Индикатором в данном случае является пиктограмма термометра (см. раздел изображения), привязанная к регистру, имеющему настроенные состояния предупреждения.
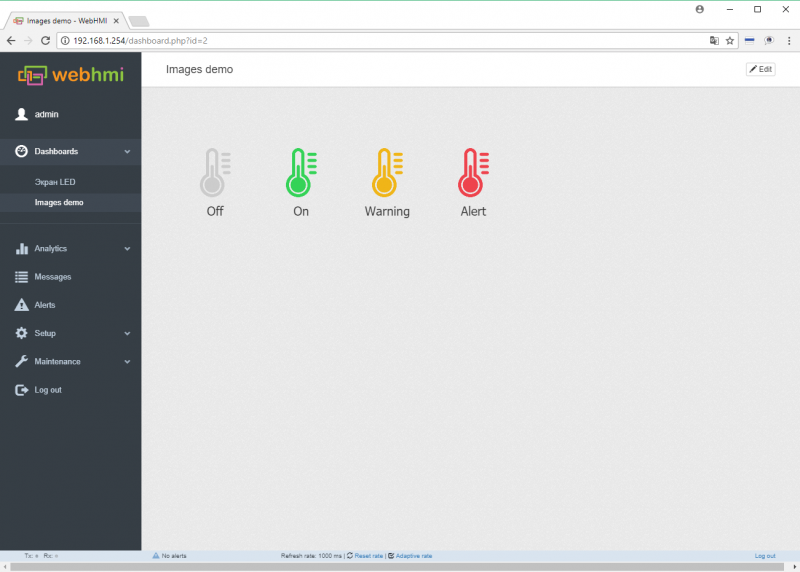
Изображение становится индикатором после привязки регистра с настроенной цветовой сигнализацией.
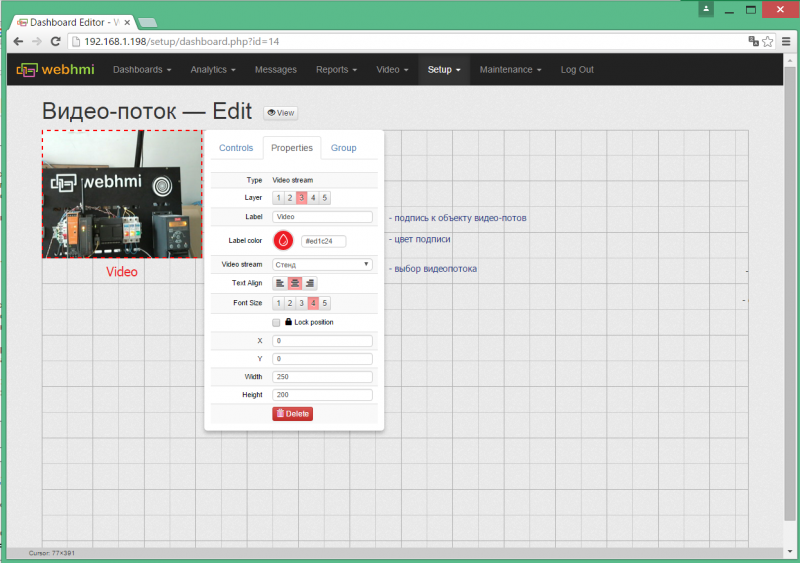
Видео-потоки
На приборной панели можно разместить объект видеопотока, который предварительно должен быть настроен в меню Setup/Video Stream. См. рис. ниже:
Кнопки
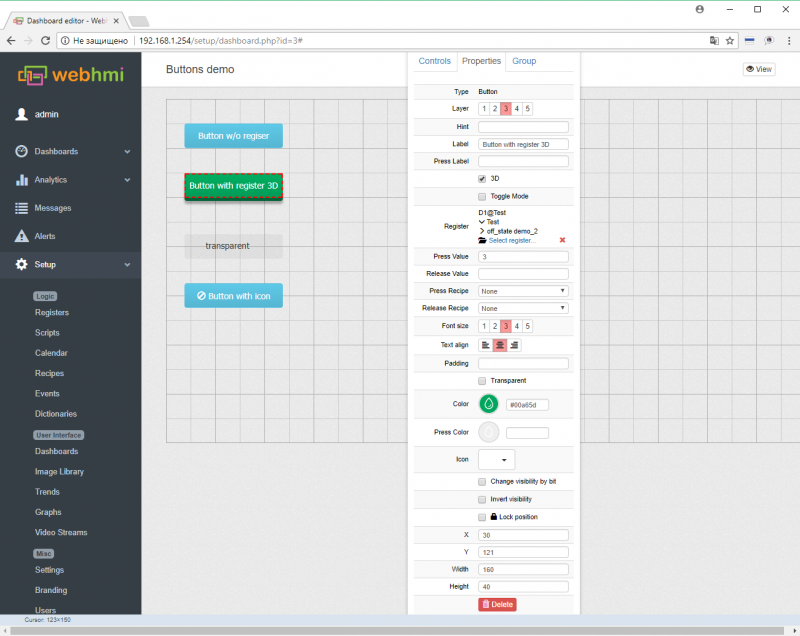
Функции кнопок -
- ссылка на другую страницу
- запуск скриптов или применение рецептов по нажатию/отпусканию
- изменение значения связанного с кнопкой регистра
Ниже приведено описание полей для настройки кнопки:
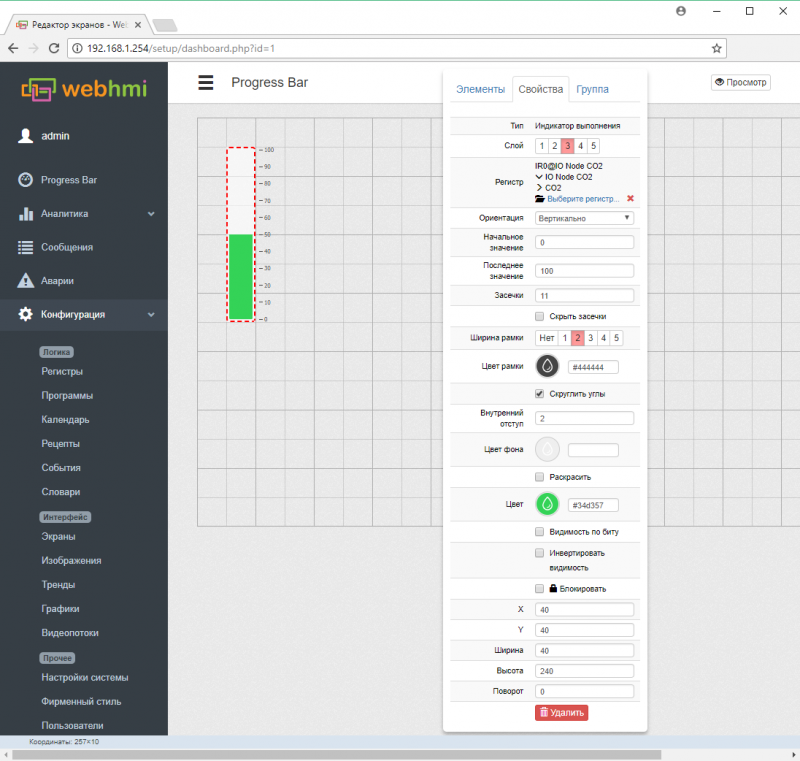
Индикатор прогресса
Значения отображаемые этими элементами представляются в виде столбиковых индикаторов, являющихся удобным графическим представлением величины параметра, позволяющим быстро оценить его текущее значение оператору.
Датчики (Gauges)
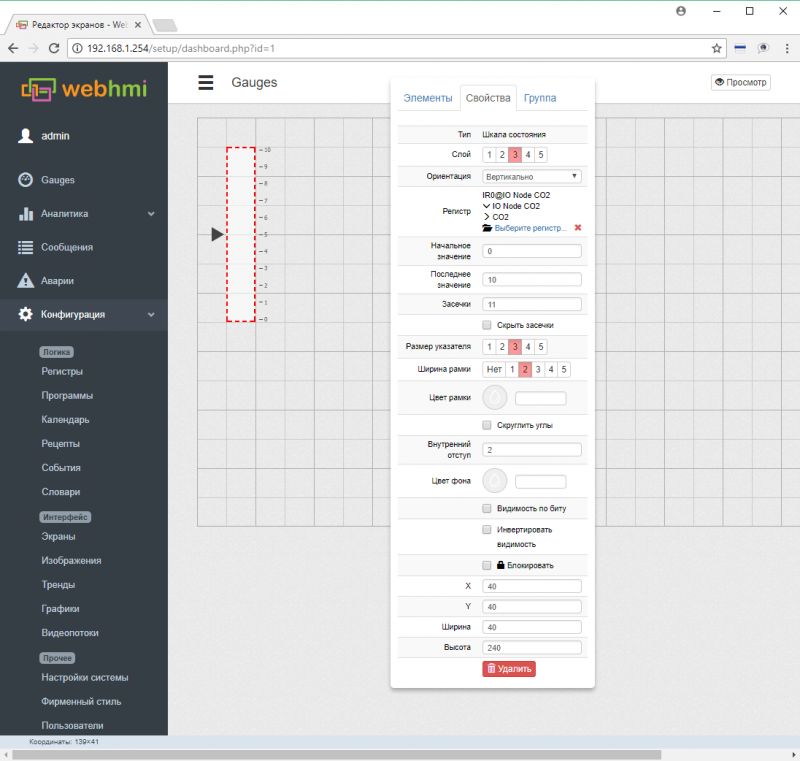
Датчики в целом аналогичны прогресс-бару со следующим отличием - величина в связанном с датчиком регистре влияет на положение ползунка, который находится рядом с основной фигурой. При включении опции Colorize будет окрашиваться тот участок шкалы, который определен как состояние.
Настройки датчика аналогичны настройкам элементам прогресс-бара, за исключением одного поля (размер указателя).
Датчик не отобразит значений, находящихся вне этого диапазона.
Слайдеры
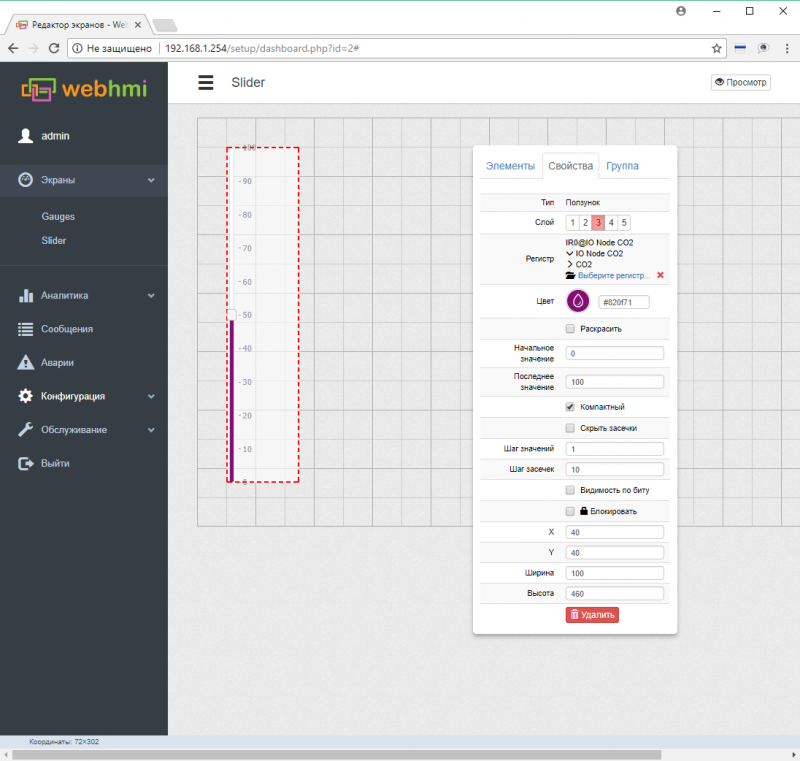
Слайдер позволяет ввести значение в регистр, двигая ползунок. Настройки приведены на рис.:
Группа
Группа позволяет выделить рамкой несколько элементов связанных общей функцией , местом или иным образом. Группе также можно задать заголовок, фон, толщину и цвет границы и др. См. рис.:
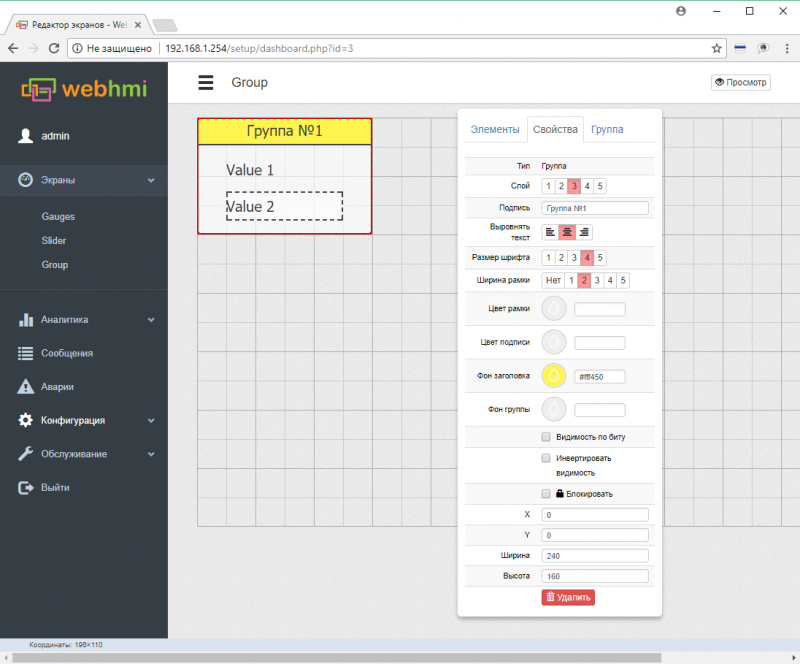
Таблица сообщений
Таблица сообщений позволяет выводить на приборной панели сообщения, вывод которых инициируется из скриптов с помощью функций AddInfoMessage, AddWariningMessage, AddAlertMessage (см. описание здесь).
Настройка таблицы приведена на след. рис.:
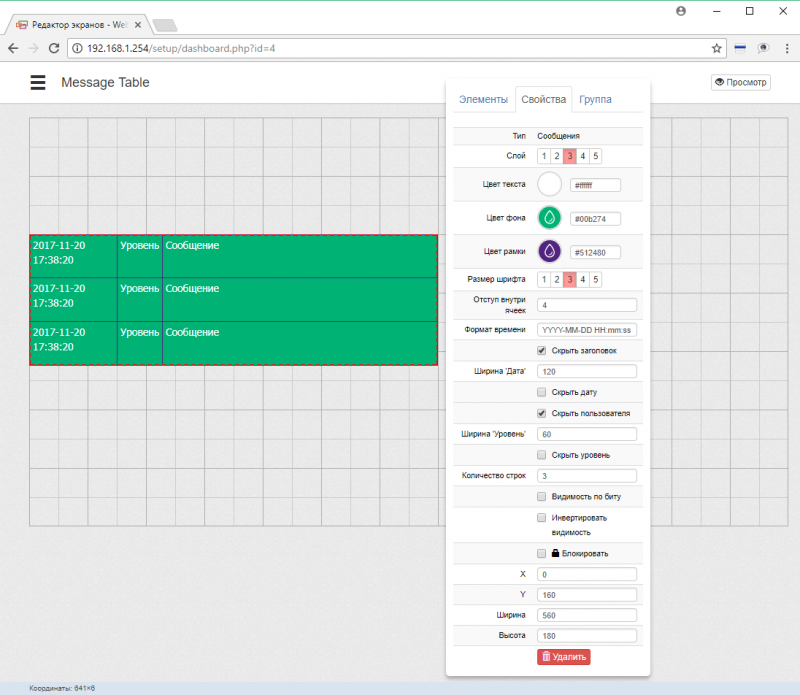
Примечание: прокомментированы только свойства, специфичные для таблицы сообщений. Остальные поля описаны в предыдущих разделах.
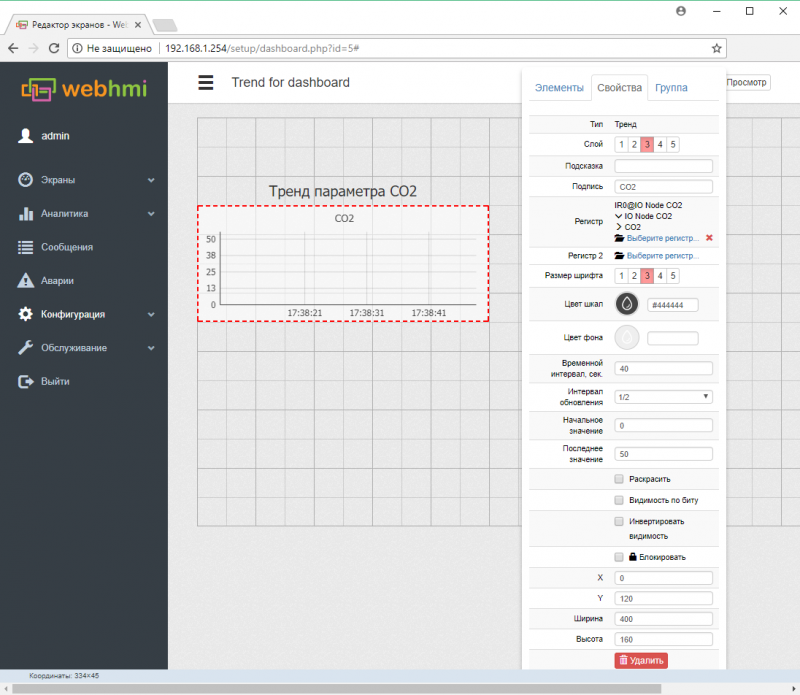
Тренд для экранов
Тренд можно также разместить на приборной панели. Данный вид тренда имеет ограничение на количество отображаемых параметров (3 для версии 1.11.0.3491). Панель настройки тренда для дешборда :
