Translations:Исторические графики/3/en
Материал из WebHMI Wiki
To create a graph, you need to select the menu item Setup / Graphs. The creation interface here is the same as in Trend Trends, except that only registers with the option 'Save data for graphs' will be displayed in the register list (see work with registers ).
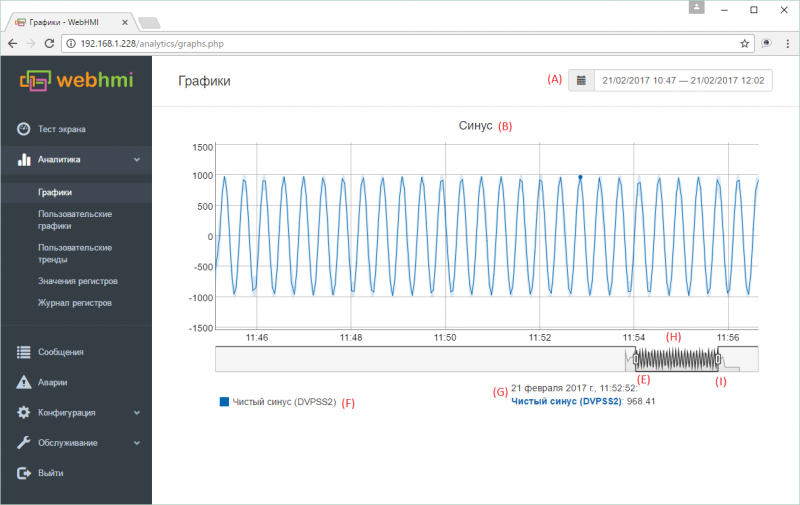
An example of a graph.


Elements of the graph:
- (А) - calendar for selecting date/period of view
- (В) - Graph title, set in menu
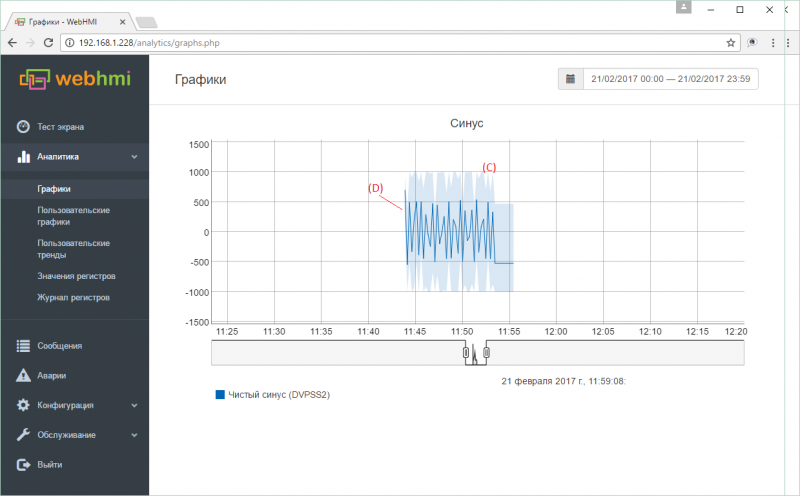
- (C) - A semitransparent color draws a range of values that the selected register took on a given plot section.
- (D) - Line of averaged values. In the case when for a selected plot scale 1 minute or more will fit into 1 pixel of the screen, then the average values of the register and the zone (C) of the range of values for estimating the distribution of the minimum and maximum peaks will be displayed on the graph. This averaging is drawn using cached data from the database, corresponding to the current scale of the view (in the database, averaging is stored for 1, 2, 5, 15 and 60 minutes). This method allows you to optimize the work with graphs when viewing large amounts of data on a different scale, while maintaining the speed of work. See below the features of working with charts.
- (Е) - slider of the viewport left border
- (F) - list of parameters displayed on the graph with the corresponding colors
- (G) - display time and parameters of the corresponding current cursor position on the line of average values on the graph (bold dot)
- (H) - viewport. By setting the desired scale of this window with the help of the left and right sliders, you can move the window along the time axis, thus choosing the interval of interest with the same time scale
- (I) - slider of the viewport right border