Translations:Исторические графики/4/en
Features of data display on graphs
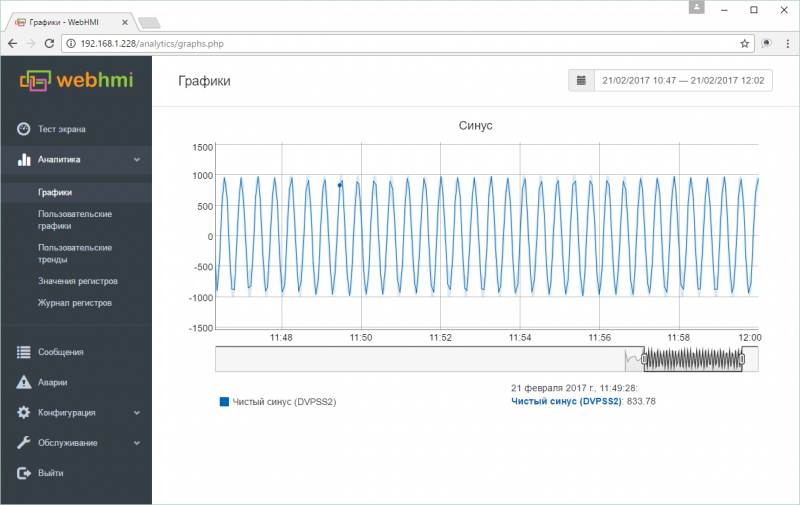
When displaying data on the graphs, if the values change much more often than the selected display scale, it is possible to get a distorted representation of the value changes. For example, the above graph is actually, when choosing the right scale, (when there is no area (C)) looks like this.
 It is seen that different values coexist on the same point of the cursor (the same instant of time) in different scales.This happens when you try to hit the point with a resolution of 1 sec. on the chart with the current one with a scale of 1 minute. In this case, the cursor will show the averaged value (see the description of item (D) above).
Thus, to obtain accurate information about the value of a parameter at a given time, it is always necessary to select the appropriate scale.
Viewing data on a large scale allows you to qualitatively assess the situation with the parameter - the presence of noise, peaks, etc. those. determine the moments of interest and then analyze them on a scale.