Translations:Экраны/4/en
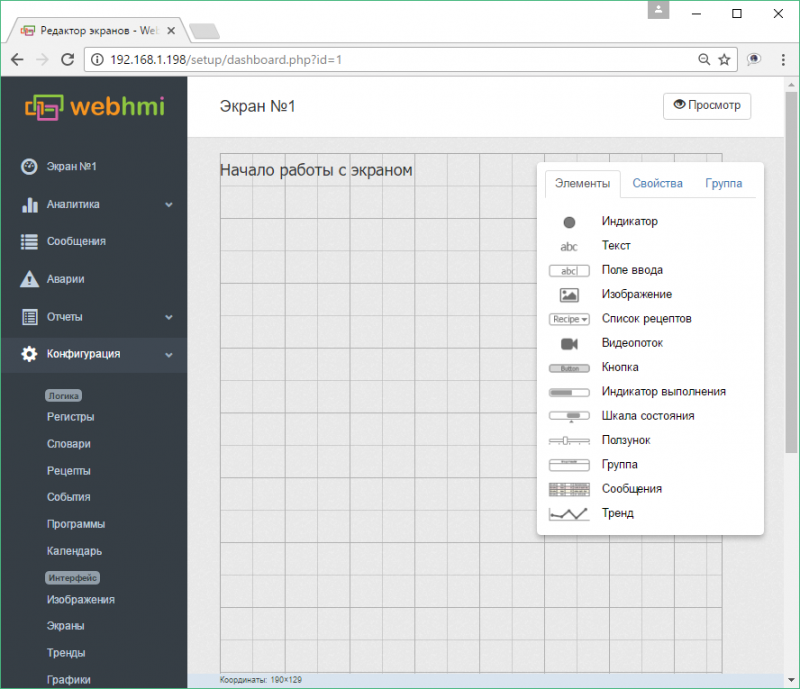
Appearance of the new dashboard panel in the editing mode:

After that, you can proceed with the layout of the visualization elements on the dashboard. The necessary elements are placed on the field by 'dragging' them from the toolbar.
The toolbar has 3 tabs:
- Controls - list of controls
- Properties - properties of the currently edited item
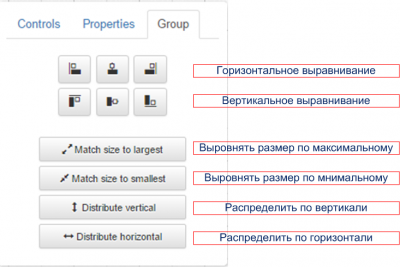
- Group - group operations, is activated when more than two items are selected
After selecting a group, the following operations are available through the tab Group:

The following kinds of visualization elements are available:
- Indicator - LED
- Text
- Text edit box
- Images
- Video-streams
- Buttons
- Progress indicators
- Gauges
- Slider
- Group
- Message table
- Trend
The editing field has a grid with a step of 40 pixels (the grid step can be redefined in the properties of the screen), by which the elements will be aligned. If necessary, align the object more accurately, this can be done by holding Shift.
When editing, the following 'hot keys' are supported -
Ctrl+A (select all), Ctrl+C (copy), Ctrl+V (paste), Ctrl+X (cut), Ctrl+D (cancel selection). You can also select any items by clicking on the desired items with the pressed Ctrl key .